
Many of us were taught to create an outline before writing something long like a paper. Outlines are helpful—they organize ideas succinctly and they force you to get to the heart of the matter. They cut the fluff.
But outlines don’t show relationships between the bulleted items in their lists. For example:
- Mound Bayou, Mississippi
- Isaiah T. Montgomery and Benjamin T. Green
- Ex-Slaves
- Founded the town
- Autonomous
- Struggling today
- Legal battles – High School
- Loss of autonomy
- Legal battles – High School
- Pride
- In its history
- As a place that many wish to visit
- As an example of freedom
- Symbolism
- Safety
- Freedom
- Community
- Isaiah T. Montgomery and Benjamin T. Green
The outline above is a sketch-level example of how an outline doesn’t present a complete picture. Autonomy and concepts of freedom pop up a few times in the outline, but they are buried under other bullets. The outline organizes content but it doesn’t help us denote important connections.
Visualizing to Make Connections Tangible
Mapping arguments by visualizing their parts can be a rewarding way to reveal many tangental, hidden, and embedded parts of the argument. Not everyone is an outliner and not everyone is a visualizer. But by combining both, often a missing component of a problem or an unexpected actor is revealed.
There’s no right way to visualize—just the way you prefer. Icons, boxes, circles, and other visual elements can add heft to your visualization. They reduce reading an argument and allow seeing an argument and its parts to take place. I’ll walk you through this process in this video.
Mapping Ideas
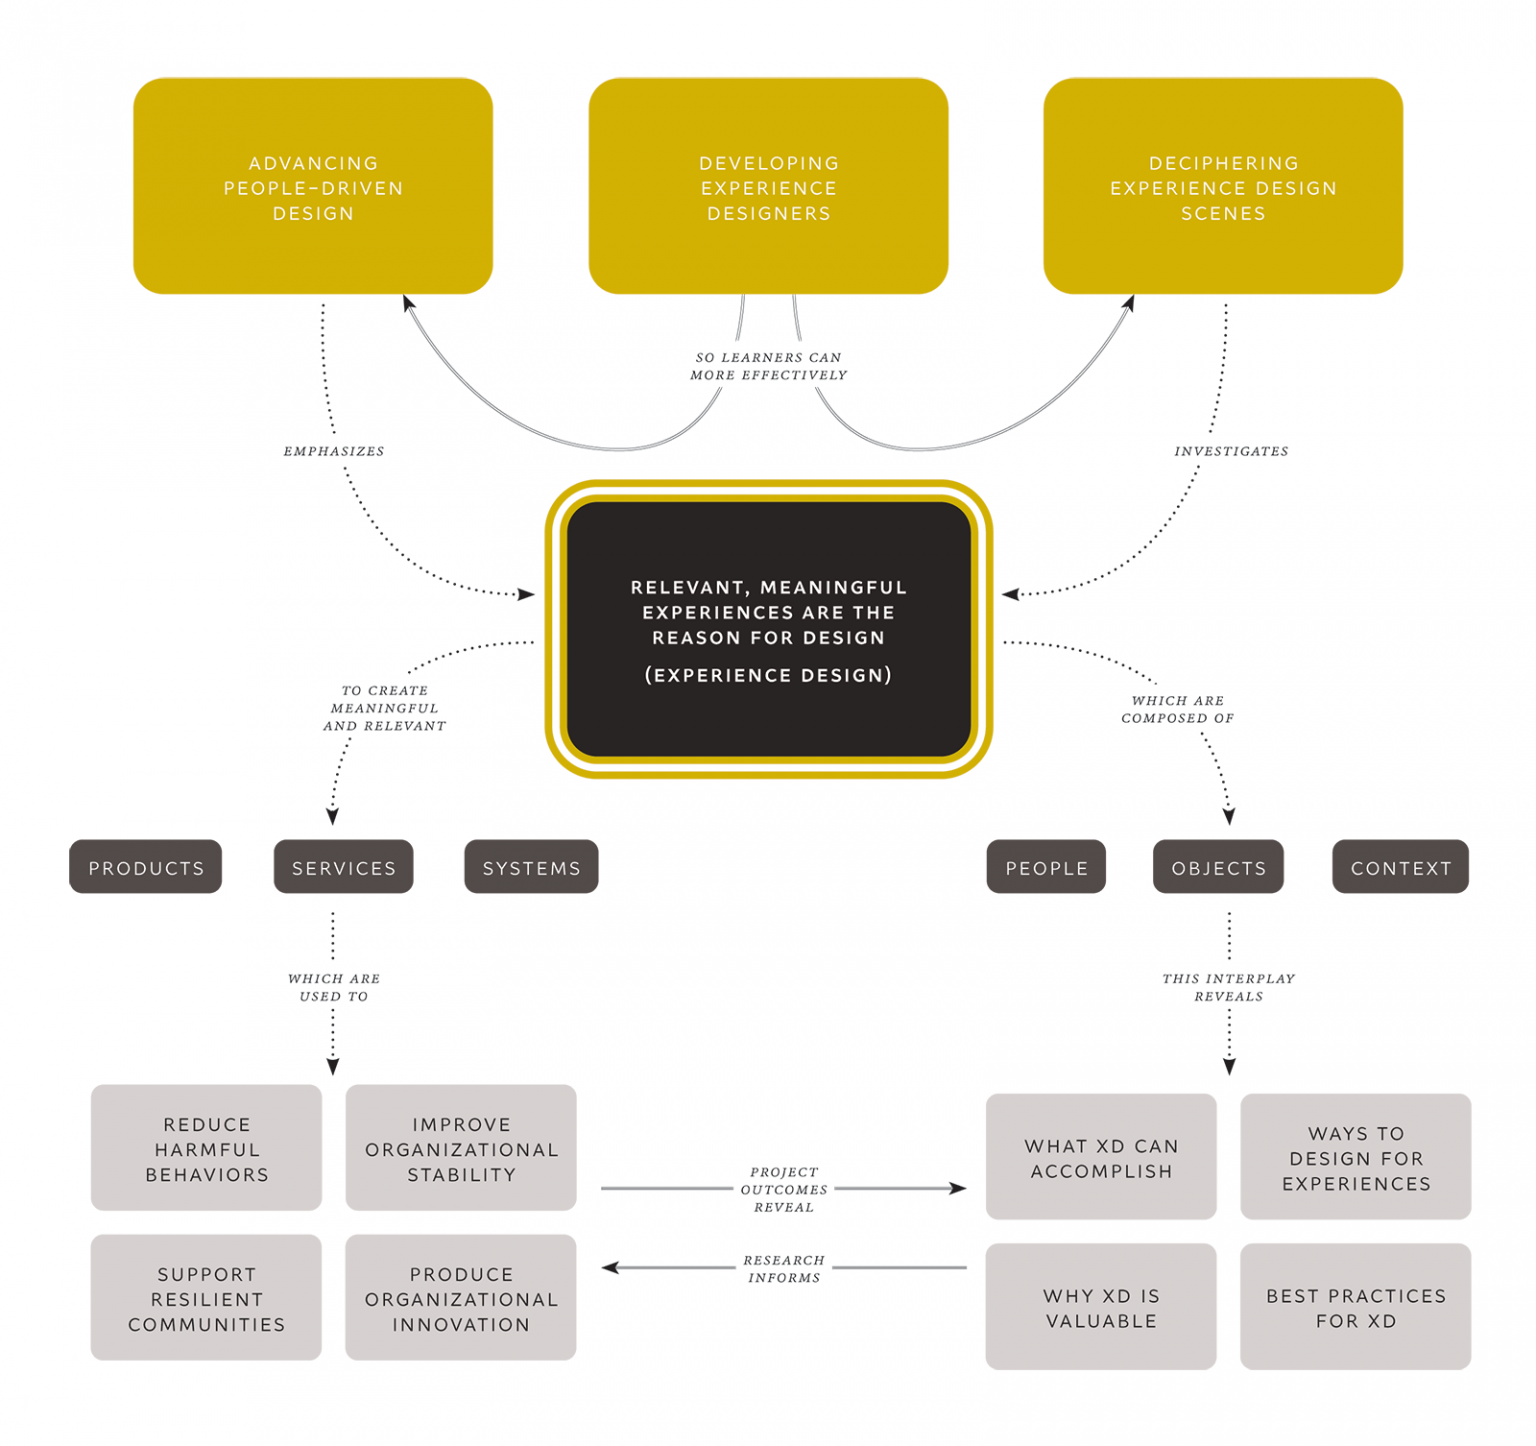
Here’s a very complex system mapping. This process took several iterations to make sure all parts were in the visualization. I created this visualization to figure out how my teaching, research, and service are related.

Yes, the map is something of a mess—but it gets everything down on one page so we can see it at a glance. This visualization led to a more polished visualization of my research areas.
Whiteboards are a fantastic place to map arguments and work out ideas. If you have access to one… use it! If you don’t… they make a fantastic gift to give yourself. 🙂
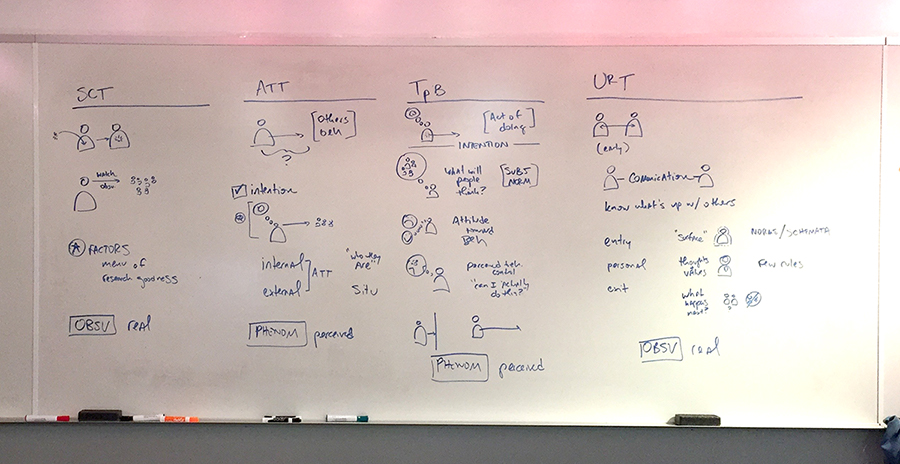
Words are complicated. Our brains must read a word then must interpret the meaning of the words. It’s a lot of work. When you visualize with boxes, colors, images, and icons, concepts can be understood more easily and combinations discovered. There’s the magic of Post-It Notes and Concept Mapping—they make ideas tangible.
Mapping Your Writing
Below is a visualization that maps challenges and possible needs that affect people recording their end-of-life choices when doing advance care planning. It’s a simple visualization that maps the parts of the argument. This was my second iteration but had I continued, I’d likely mapped out more and more parts of the issue I had not previously considered. With each iteration, go back to your source material: books, blog posts, journal articles, etc. are your secondary research. They should fuel the parts of your visualization.
I’ll break the visualization down into discrete parts below.
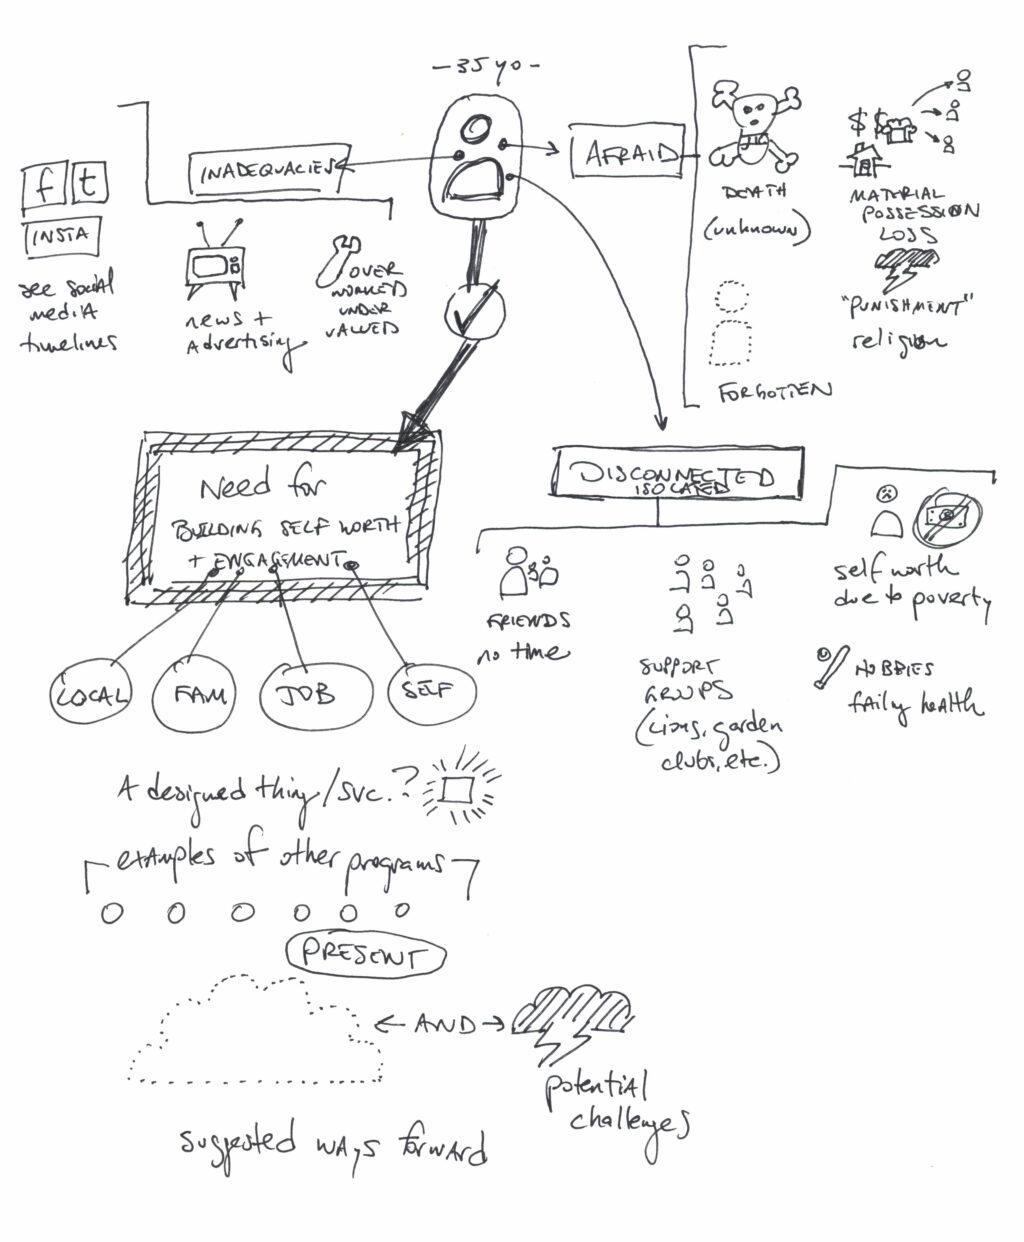
The Main Actor
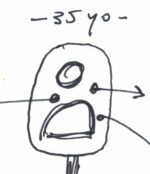
The visualization starts with the main actor: my 35-year-old person. This is a very generic person, but yours should likely be much more detailed to focus your argument.
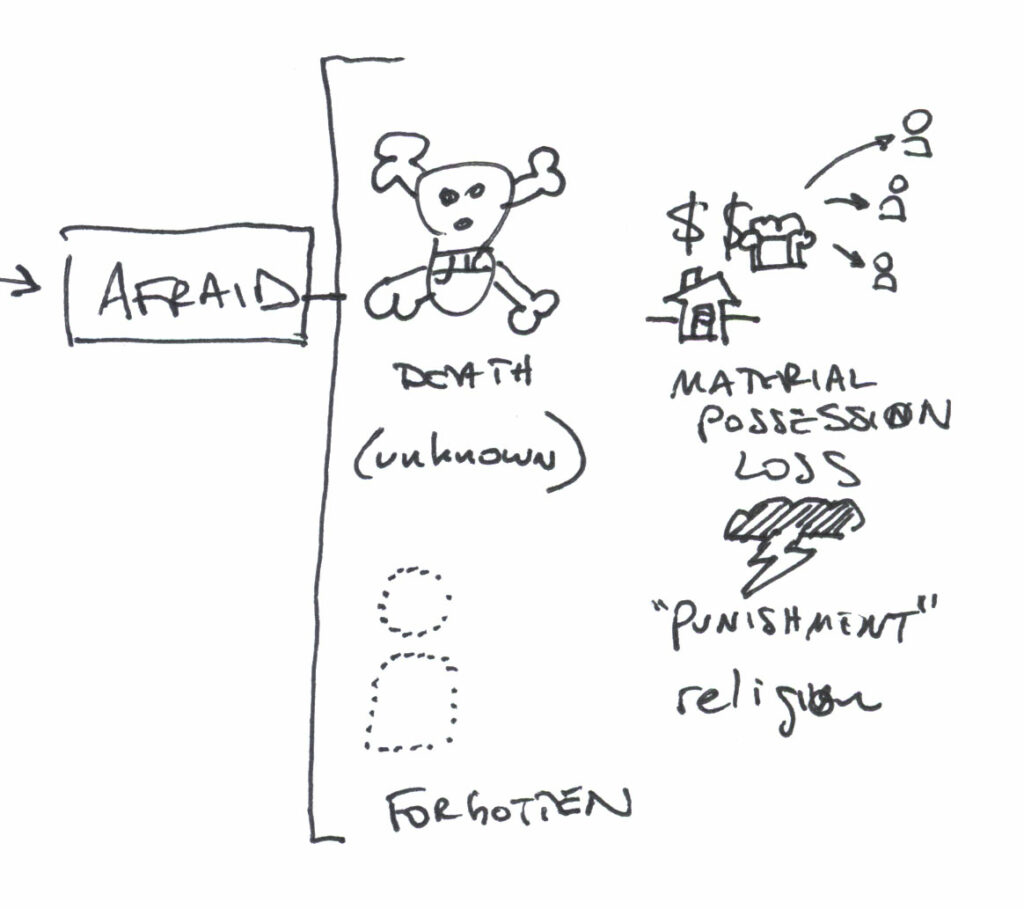
Challenges
Some challenges exist in this problem, all under the “afraid” grouping.
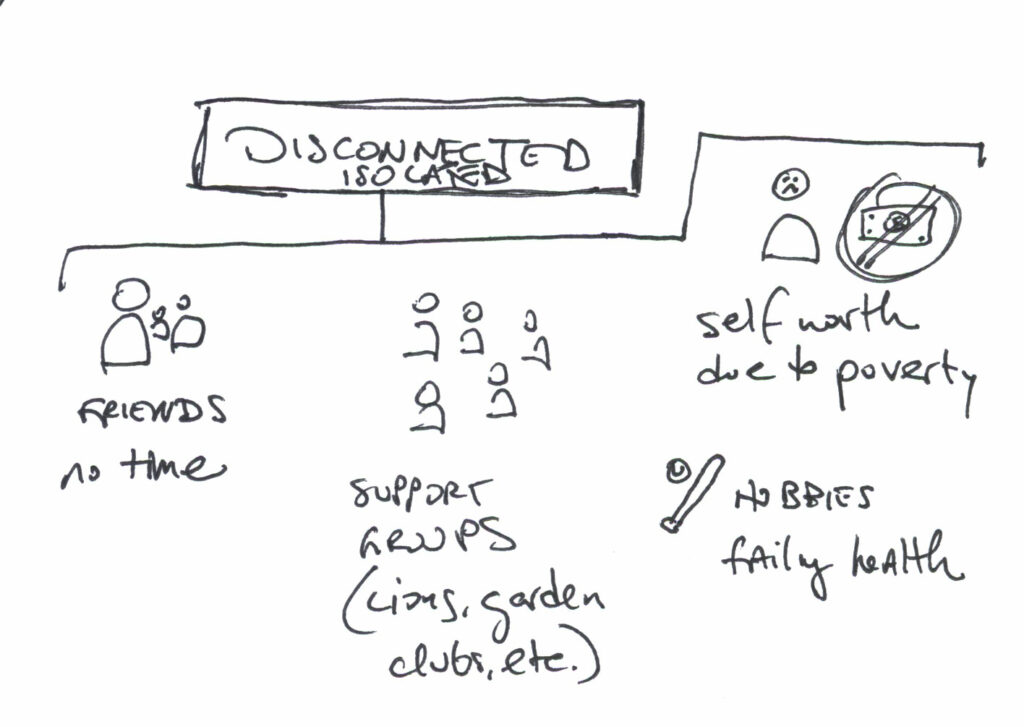
More challenges exist in this problem, all under the “disconnected and isolated” grouping.
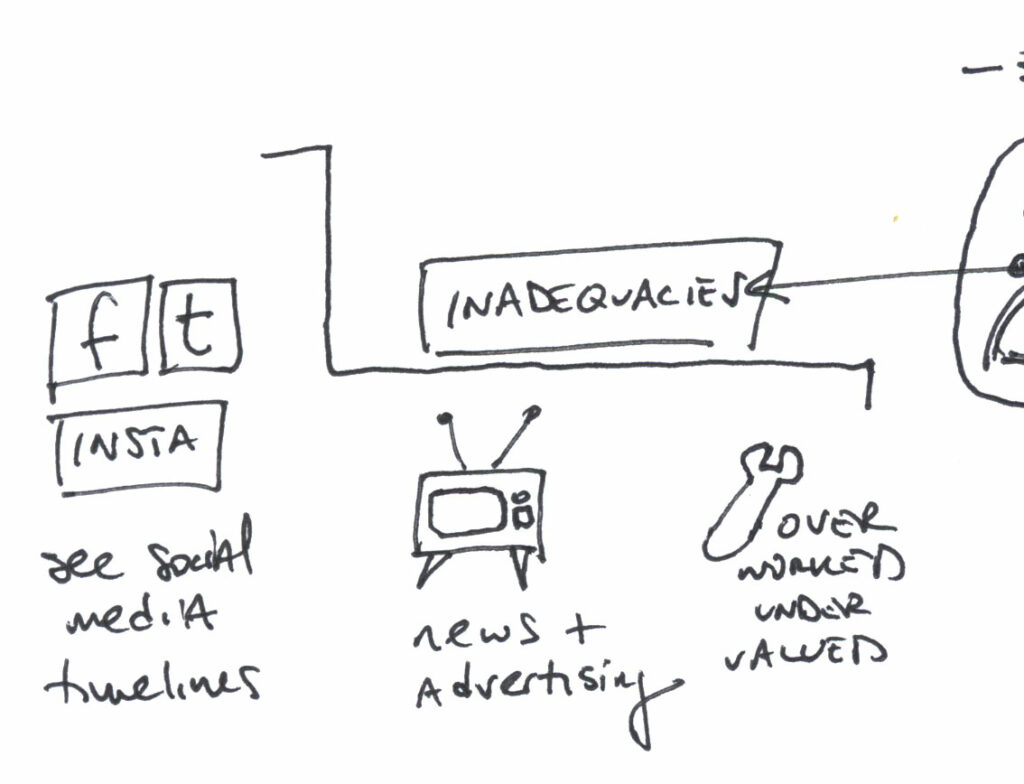
More challenges exist in this problem, all under the “inadequacies” grouping.
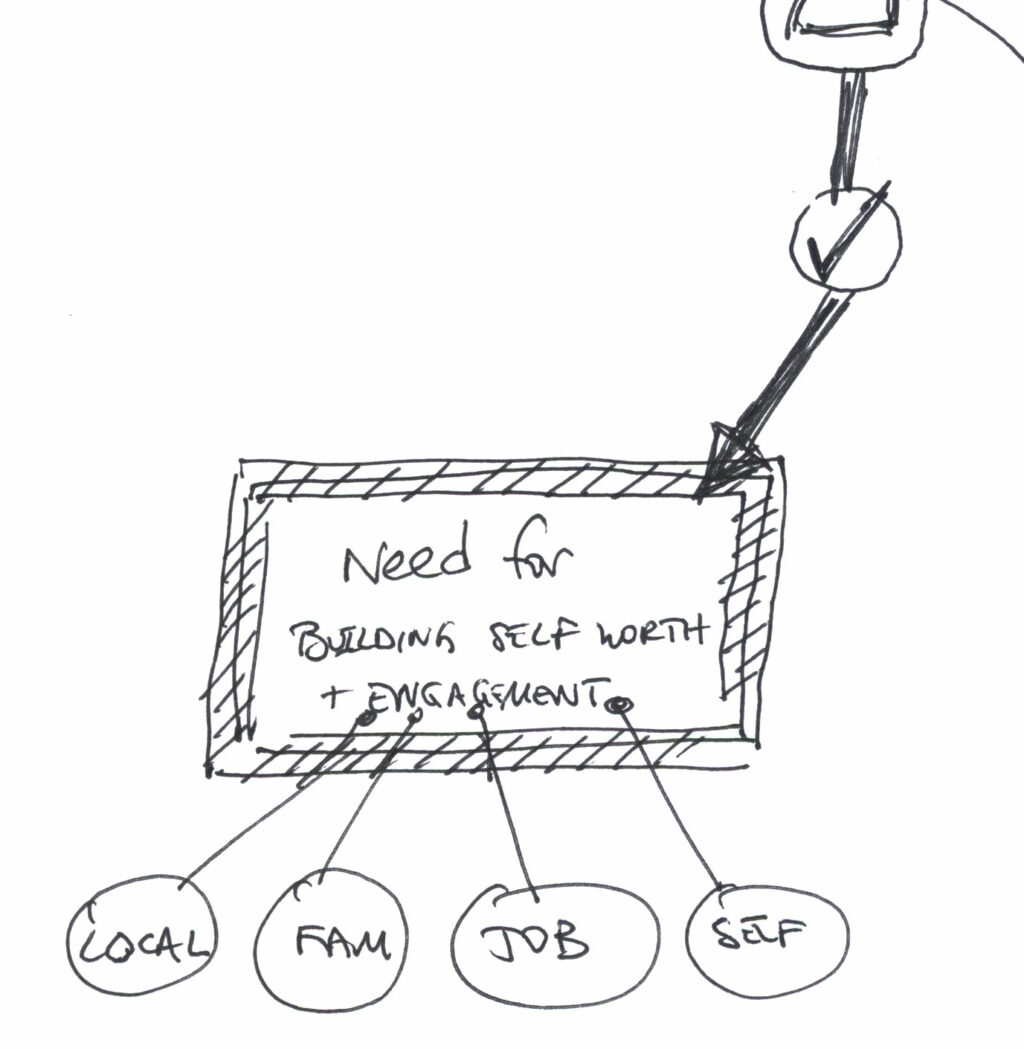
Need (the Solution)
The need that must be addressed. This is my “way forward” argument.
Intervention: Ups and Downsides
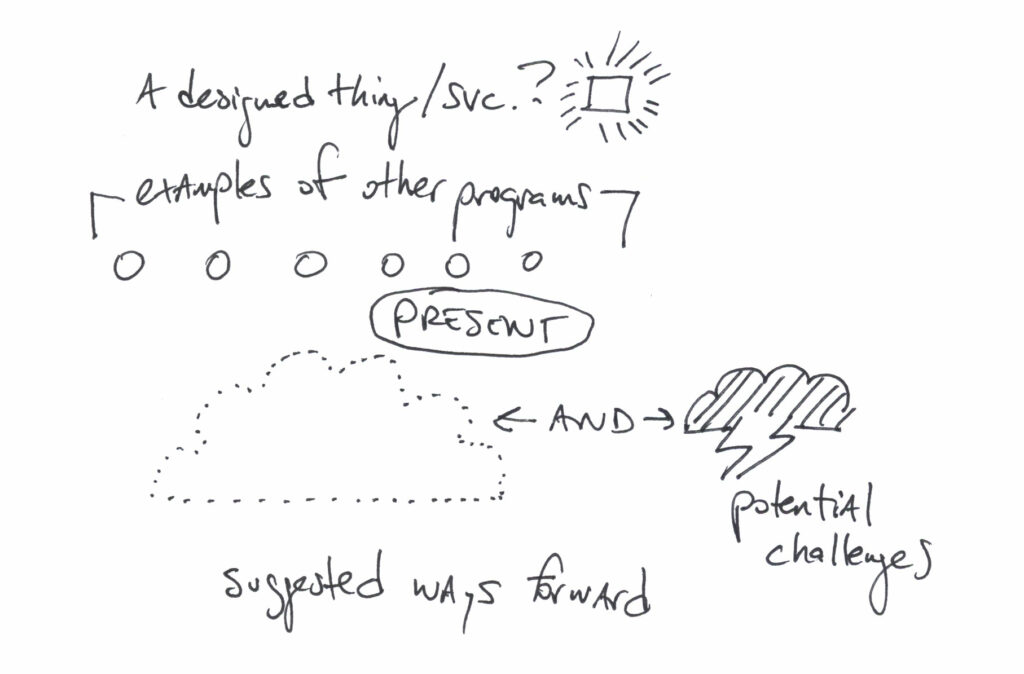
I’ll propose we need to design something to impact the problem. Below, I just leave it as “a designed thing/service?” and indicate that I would cite other existing programs that have been successful. If I did another visualization, I would continue to refine this. I also list that I need to address the possible downsides of some of my proposed solutions.
Recap
All together, visualizing the entire argument compliments my outline as an exploratory process that activates a different part of the brain.